Case Study – Provide Analytical Tools for a Limited Internal Business Process Review by a Not-for-Profit
Why this case study is presented
This is a case study for a very small business analysis consultancy project. It looks at the use of business function mapping, functional decomposition and RACI analysis in the context of a project to solve business process issues, without the prospect of procuring new software. It describes key analytical tools, illustrates their flexibility and explains why they were used in this particular case.
The client
The client was a not-for- profit organisation that cannot be identified in this case study.
The client arranges public events using a range of personnel and technical inputs. It operates with a range of business units, roughly aligned to business function.
The problem presented
One of the business units wanted to review its operations to resolve some process interactions with another unit and to address some resourcing issues.
The organisation had no internal documentation of its processes. When a manager wished to discuss issues with personnel from another work unit with which it interacted, there was no definition of processes that could be used to focus on the sources of problems. Each unit had a different view of its work tasks, and applicable responsibilities and accountabilities. The business managers did not know how to start to solve their problems. There was not even an agreement that the problems existed.
This was not a software requirements project; no new software was to be procured as a result of this project.
Elkera’s principal consultant was asked to provide guidance on the analytical approaches the managers might use to help them with their analysis, without the need to acquire advanced skills.
Assessment of the client’s need
This business had very specific characteristics and needs. It has a very large number of distinct inputs into its outputs. There is a high level of overall planning. There is a high level of collaboration between the various business units to bring everything together. Some functions are not necessarily housed in their logical functional area.
The objective was to enable the client managers to analyse relevant parts of the business in a way that would help them identify problem areas so they could collaborate to resolve problems without engaging a consultant.
Before the client managers could begin problem solving, they needed to develop a common language for, and understanding of, the relevant business processes. They also needed to know the personnel who were accountable and responsible for relevant problem processes.
Elkera’s approach
Elkera proposed that the client manager should follow a three-step approach to the problem analysis:
- Develop a map, or set of maps, showing all important business functions that contribute to its business outputs;
- Using the primary functions from the functions map, develop a functional decomposition hierarchy and RACI matrix;
- Identify sub-processes in the RACI matrix that are the source of problems and undertake a problem analysis on each, covering the problem description, causes and solution options.
Each of those steps is described in more detail below.
The business function map
The goal for this step was to identify all important business functions that could be decomposed into their sub-processes to a level that supports problem analysis.
A function map provides a convenient visual device to organise and collect business functions so that stakeholders can contribute and validate them. It is far easier for stakeholders to see if something is missing or wrong when looking at a simple diagram, than reading a list in a text document.
The approach taken was to use the concepts of a value stream map. To produce the outputs of the organisation, there are the main inputs (primary functions), organisation-wide support functions and secondary functions.
The support functions are those such as HR, Finance and Operations. They should be included because they will be stakeholders in the RACI matrix to be developed in stage 2. The main inputs, or “primary functions” are the direct inputs into the organisation’s outputs. They might be items such as “provide product marketing” or “provide transport”. Secondary functions are those needed to manage the primary functions. They might include such functions as “recruit personnel” or “manage budgeting”.
Diagram 1 below shows the first step in the function map development: the top-level view showing organisation-wide support functions and primary functions with the organisational products.
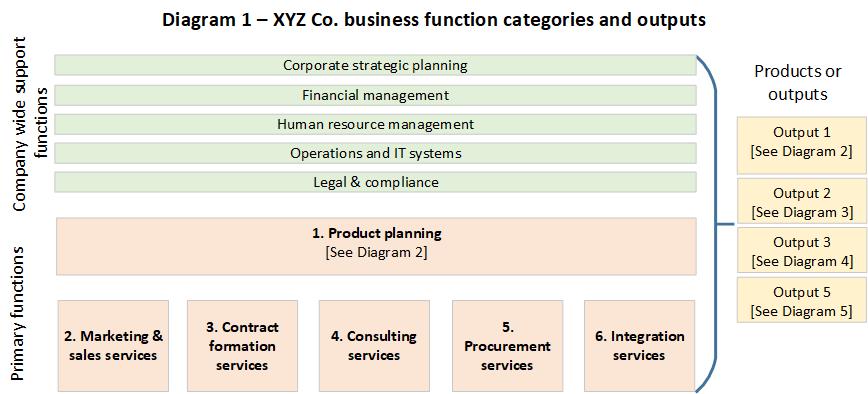
Diagram 2 shows the second step, with the top-level categories filled with the primary functions. For economy of space, we did not repeat the list of support functions on the second diagram.
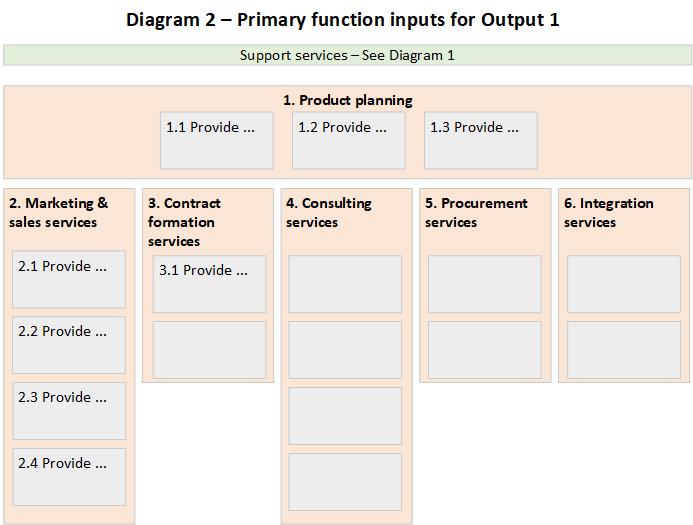
This function map only included the primary functions. The secondary functions are picked up in the next step. Including them in the main function maps would not further assist in understanding the business but it would add complexity, making it harder to focus on the important functions.
A map of primary functions is developed for each product or output. Primary functions will vary between products or outputs. Functions may be re-created for good or bad reasons. Those cases should be identified.
As a final stage, functions were mapped into business units. Doing so made it possible to see where possible misallocations occur.
The development process was not linear. There were multiple iterations. New categories were identified as each output was analysed. Only after completing the function analysis for all outputs was there a complete set of categories.
Functional decomposition and RACI matrix
The objective of this step is to define business processes to a sufficient level of detail that they can be targeted for problem analysis.
The functional decomposition and RACI matrix combines two distinct tools. The first is a functional decomposition. A common analytical tool for business process analysis is to develop a functional decomposition diagram, which is a tree structure, showing the hierarchy of functions and their sub-processes. In this case, the tree structure was not useful. We needed a hierarchy of functions and sub-processes that we could use in a RACI matrix, in the form described below:
- Marketing and sales services (category)
- Provide sales campaigns (function)
- Define campaign targets
- Develop campaign theme
- …
- …
- Provide sales campaigns (function)
- Contract formation services (category)
- …
The primary functions are those taken from the function diagram (See Diagram 2). Each function is then broken down into its sub-processes.
Secondary functions within each category are also added, with their sub-processes. In the functional decomposition, they are treated in a similar way to primary functions.
The functional decomposition not only identifies processes for further analysis, it provides a taxonomy of business functions that supports clarity of communication and analysis between stakeholders.
The second component is the RACI matrix. A RACI matrix is commonly used to identify stakeholders in projects and their interests, usually: R (responsible), A (accountable), C (consulted), or I (informed). It is just as useful in business analysis.
The two tools are combined in a spreadsheet or Word table with the numbered functions and sub-processes in the rows and stakeholder and their interests in the columns, as shown in the Diagram 3:
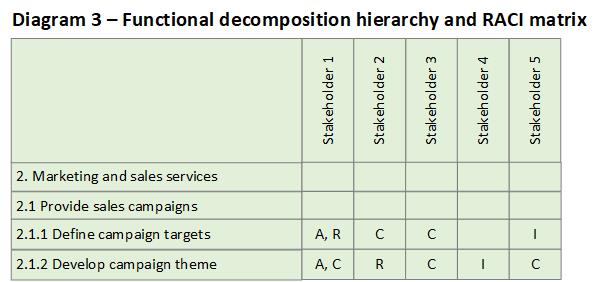
For each sub-process, stakeholder interests are listed using RACI values or other classifications that are considered useful. Stakeholders can include business database applications where information is input (I) or reported (C).
A functional decomposition might include four levels, starting with the category. In this case, three levels were sufficient to support the problem analysis. In this case, there was no intention to develop business process diagrams unless absolutely necessary to analyse particular problems in depth.
The functional decomposition and RACI matrix is an important tool. It enables all parties to focus on a particular sub-process and know who they need to work with to solve identified problems.
Problem analysis
Once the functional decomposition and RACI matrix was complete, it was fairly easy to identify functions that were misplaced in business units and the sub-processes that were the source of reported problems. Due to the nature of the business processes in this case, it was not necessary to undertake a more formal analysis to identify waste and process errors.
The problems reported by managers were separated, described and linked to the relevant numbered sub-processes from which they originated.
Only a relatively small number of processes were targeted for further analysis. The client managers now knew the precise processes affected, and who were the accountable and responsible parties for each. Problem analysis and solution planning could begin.
The relevant managers met to analyse the problems. For each problem, they assessed:
- The problem causes
- Solution options.
Solution options could include any or all of: improved training of staff, improved supervision, procedure documentation, changing processes, changing related processes, or re-locating the process to another unit where it could be more effectively managed.
Based on that analysis the managers developed recommendations for agreed upon changes.
The results
Implementation of recommended changes is out of scope for the consultancy and this case study.
The solution proposed by Elkera was very effective at solving the problem presented. It provided the client’s managers the tools they needed to analyse and address their problems.
For the first time, the client had a clear visual representation of its business functions, how they varied across outputs and how they aligned to business units. It also had a clear breakdown of the specific functions undertaken by significant areas of the business.
The client may need to procure new software systems in future. When that occurs, it will have a good foundation for the requirements analysis process.
Lessons learned
The visual map of business functions works very well to enable stakeholders to assess and agree on the key business functions of the organisation.
The functional decomposition and RACI matrix is an excellent tool to define business functions and sub-processes with their stakeholder relationships. That definition supports a wide range of further analytical exercises, from basic process problem solving, as in this case, to the development of detailed business process models using a tool such as BPMN.
The project began with a limited scope to assist managers of particular business units. That led to an attempt to try to constrain the top-level analysis of business functions. We soon found that was a mistake. We had to develop a complete view of the top-level functions before we could reliably determine the business functions and sub-processes that were the sources of reported problems.
These projects require active support from senior management to encourage all necessary stakeholders to participate enthusiastically in the process. It is also very beneficial for the process to be assisted more directly by a trusted, independent analyst whose recommendations may help mediate the competing interests of different stakeholders.
Elkera Pty Limited


Related Topics